 blog
Is a Biostimulant Programme Worth the Cost?
Last Updated: 28 October 2026
Quick Summary
A biostimulant programme is worth the cost when its added revenue and costs avoided exceed the full programme cost, including product, extra passes, tank-mix labour and testing. Calculate return on investment as added revenue plus costs avoided minus programme cost, divided by programme cost, and model good, average and poor seasons.
- Extra spray passes often account for 30-50% of the true total cost.
- Record soil and tissue baselines before the first application to enable attribution.
- Velcourt trials found AminoA FLO at reduced fungicide rates maintained winter wheat yields.
- Run the return on investment calculation for good, average and poor seasons.
- The Nutri2Cycle tool calculates the maximum price payable before a product stops paying for itself.
Table of Contents
- What a Cost-Benefit Analysis of Biostimulant Programmes Must Include
- Biostimulant Application Costs: What You Actually Pay Per Hectare
- Biostimulant Trial Results: Reading the Evidence Before You Budget
- Soil Testing for Crop Nutrition: Setting the Baseline for Any Comparison
- Calculating Biostimulant Return on Investment Season by Season
- Comparing Biostimulant Programmes Against a Straight NPK Increase
- Building a Cost-Benefit Model for Your Own Farm
- Frequently Asked Questions
What a Cost-Benefit Analysis of Biostimulant Programmes Must Include
A cost-benefit analysis of biostimulant programs is a structured comparison of every cost a programme adds against every measurable gain it produces, expressed per hectare and per season. Growers can run this exercise badly by counting the invoice but not the passes, and the yield but not the quality.
Get those four cost lines and three benefit lines right and the biostimulant programme decision becomes arithmetic rather than faith.
The four cost lines most growers miss
Most budgets stop at product price. The real figure includes:
- Product cost per hectare, based on label rate and number of applications
- Extra spray passes, including fuel, operator time and machinery wear
- Tank-mix labour and mixing time, which rises with every additional can
- Testing and monitoring, from soil analysis to tissue sampling
The fourth line is the one that quietly decides the result. Without a baseline, you have no way to attribute a yield change to anything.
The benefit lines that carry the return
Three benefit lines matter, and only one of them is yield. Yield is the headline, but quality premiums, reduced fungicide spend and stress-loss avoidance can also be included in the analysis.
Biostimulant Application Costs: What You Actually Pay Per Hectare
Application costs are the sum of product, passes and labour. A product applied three times costs three times the passes, not one.
Work out your own figure rather than borrowing someone else's. Product cost depends on rate and pack size, so pricing depends on quantity, dates and delivery. Ask for a quote against your actual cropped area and timing.
Product, passes and tank-mix labour
A simple per-hectare build looks like this:
| Cost line | What to record | Why it matters |
|---|---|---|
| Product | Rate × applications × area | The visible cost |
| Passes | Diesel, depreciation, operator hours | Often 30-50% of the true total |
| Tank-mix labour | Mixing, filling, cleaning time | Scales with number of cans |
| Testing | Soil and tissue analysis | Enables attribution |
For wheat specifically, application rate guidance determines both product volume and water volume, so check the label rate before you model anything. Our article on liquid biostimulant application rates for wheat sets out the figures you need.
Biostimulant Trial Results: Reading the Evidence Before You Budget
Trial results are only useful for budgeting when you know the baseline, the season and the rate used. A percentage yield lift quoted without those three details is difficult to assess.
Look for trials run against a treated control in a comparable season, at a stated rate, with the measurement method described. Independent and manufacturer data both have a place, but read them with attention to the trial design and context.
The strongest evidence for a programme is often not yield at all. Velcourt trials found that adding AminoA FLO to reduced fungicide rates maintained yields and improved green leaf area in winter wheat. That is a cost-avoidance result, and cost avoidance is easier to bank than a yield promise.
Before you accept any trial figure, confirm how nutrient uptake was measured. Peer-reviewed work on biostimulant economics continues to develop, with research examining adoption factors and economic assessment noting that uptake varies widely between farms.
Soil Testing for Crop Nutrition: Setting the Baseline for Any Comparison
Soil testing for crop nutrition measures available nutrients and soil condition before a programme starts. It can provide a baseline for considering later changes alongside factors such as weather, rotation or fertiliser policy.
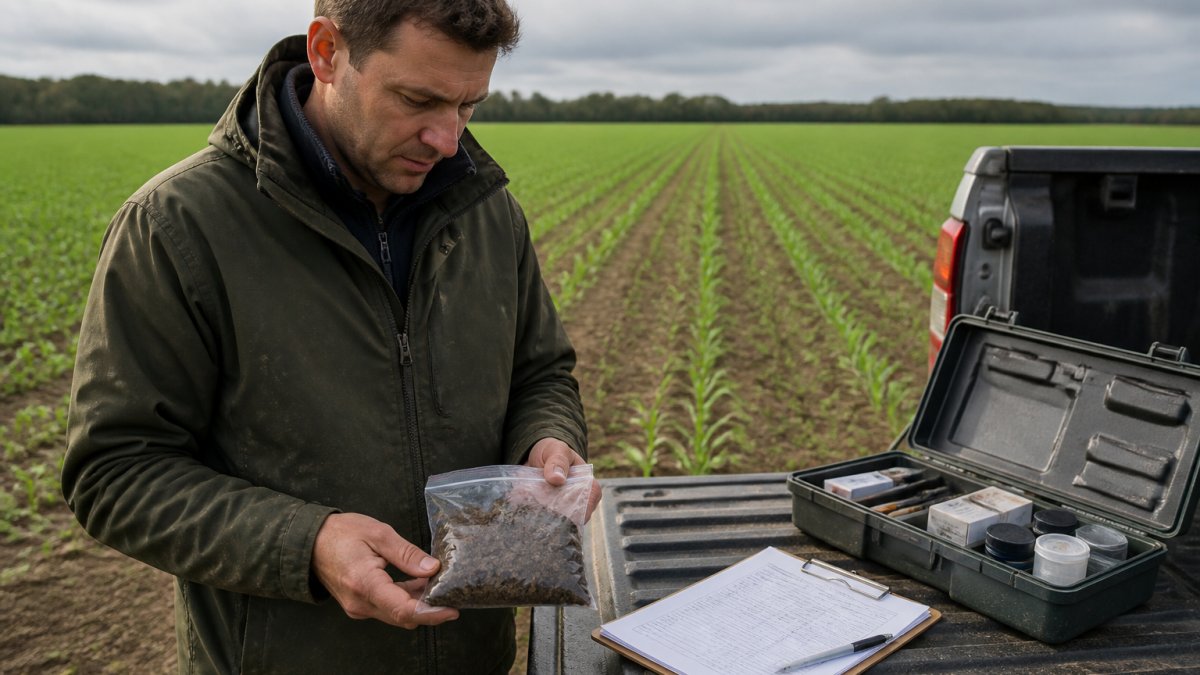
Sample the same points, at the same depth, at the same time of year, on both treated and untreated blocks. Record the results before the first application.
Calculating Biostimulant Return on Investment Season by Season
Biostimulant return on investment can be calculated as total additional margin divided by total programme cost, per season or across a rotation.
The calculation:
ROI = (added revenue + costs avoided − programme cost) ÷ programme cost
Added revenue covers yield and quality. Costs avoided covers reduced fungicide or fertiliser spend. Run it three ways: a good season, an average season and a poor one.
Amino acid programmes and straight input increases can be assessed using the same cost-benefit framework. The Nutri2Cycle cost-benefit tool for bio-based fertilisers takes a similar approach, helping users calculate the maximum price payable before a product stops paying for itself. That ceiling price is the number worth knowing before any conversation about rate.
Comparing Biostimulant Programmes Against a Straight NPK Increase
Comparing a biostimulant programme with a straight NPK increase requires considering their different inputs and costs.
The comparison should account for nitrogen rates on both sides.
| Factor | Biostimulant programme | Straight NPK increase |
|---|---|---|
| Primary effect | Uptake efficiency, stress tolerance | Raw nutrient supply |
| Cost profile | Product plus passes | Product plus spreading |
| Risk in a poor season | Can protect yield | Adds cost, no protection |
| Quality premium potential | Often positive | Limited |
| Regulatory pressure | Low | Under increasing scrutiny |
The New Phytologist review of the biostimulant market forecasts global growth from US$4.1 billion in 2025 to US$11.2 billion by 2035, which tells you where the industry expects value to sit. For a direct side-by-side on cost and return, read our biostimulants versus synthetic fertilisers cost-benefit comparison.
Building a Cost-Benefit Model for Your Own Farm
Building a cost-benefit model can start with your own field records. Use yield, quality and input-spend records as a baseline, then layer the programme costs on top.
-
Record soil and tissue baselines for every block
-
Calculate product, pass and labour cost per hectare
-
Model good, average and poor season scenarios
-
Review at harvest against the baseline, not against memory
Fitting a programme into an existing nutrition plan rather than bolting it on is one approach to consider when assessing application passes. For practical guidance on integrating biostimulants into crop nutrition programmes, see our article.
The hard part is not the arithmetic. A baseline can help you assess a programme when the result is still unknown.
At AminoA, we manufacture L-α amino acid biostimulants through enzymatic hydrolysis, with every essential amino acid in the L form and a high content of nitrogen, potassium, iron and magnesium. Our products support root, leaf and bud development, and help crops resist cold, heat, drought and agrochemical phytotoxicity. Subscribe to our Newsletter.
Frequently Asked Questions
How do you calculate the return on investment of a biostimulant programme?
Add up the costs you are assessing, such as product, application passes and labour. Then compare them with the benefits you are assessing, such as yield, quality or costs avoided. The Nutri2Cycle project has published a cost-benefit tool for bio-based fertilisers.
What costs should be included in a biostimulant cost-benefit analysis?
Most growers count the product and stop there. Include the application pass, water volume and operator time. If you are comparing against a straight NPK increase, add the cost of the extra product and spreading. Also account for soil and tissue testing as part of your assessment. Pricing depends on quantity, dates and delivery, so request a quote rather than working from an assumed figure.
How many seasons of biostimulant trial data are needed before committing?
Velcourt trials found that adding AminoA FLO to reduced fungicide rates maintained yields and improved green leaf area in winter wheat.
How can soil and tissue testing help assess a crop nutrition programme?
Soil and tissue testing can provide information to consider when assessing a crop nutrition programme. Sampling consistently can help you compare results over time. A yield difference between fields may have several possible explanations.